Customizing the Kaplan-Meier Survival Plot
Unicode Values Require Alternative Processing
The following steps attempt to replace the ordinary hyphen with a longer dash (that is, they attempt to replace '-' with '—') and run PROC LIFETEST:
proc format;
   value $dfmt "AML-Low Risk"  = "AML(*ESC*){Unicode '2014'x}Low Risk"
               "AML-High Risk" = "AML(*ESC*){Unicode '2014'x}High Risk";
run;

ods graphics on;
proc lifetest data=sashelp.BMT plots=survival(cb=hw atrisk(outside maxlen=13));
   time T * Status(0);
   strata Group;
   format group $dfmt.;
run;
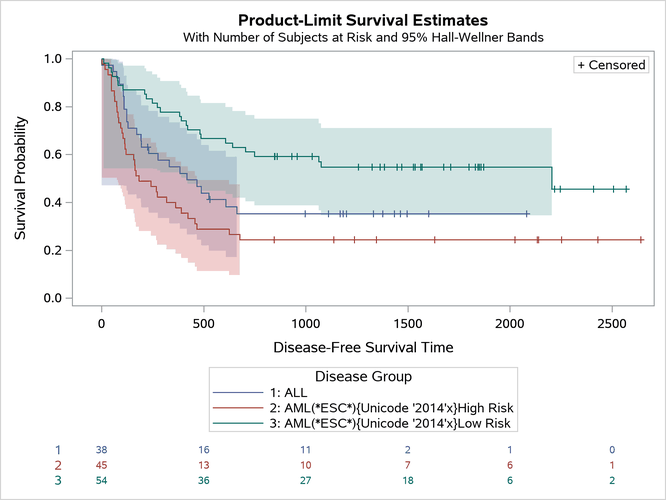
The table and graph that are displayed in Figure 40 show a difference between how ODS handles Unicode characters in tables and how ODS Graphics handles Unicode characters in graphs. When ODS creates tables and processes an escape sequence and a Unicode character in the value of a column, it substitutes the special character in the output. (This discussion does not apply to the LISTING destination.) When ODS Graphics creates graphs and processes an escape sequence and a Unicode character in the formatted value of a column, it substitutes the special character in the output. In other words, in ODS Graphics, you can use Unicode only with formats. This might seem puzzling, because this example does in fact use a format, but it does not display the formatted value. It does not work as expected, because PROC LIFETEST does not send unformatted values and the format to ODS Graphics.
Figure 40: Unicode Displays Automatically in Tables but Not Graphs
| Summary of the Number of Censored and Uncensored Values | |||||
|---|---|---|---|---|---|
| Stratum | Group | Total | Failed | Censored | Percent Censored |
| 1 | ALL | 38 | 24 | 14 | 36.84 |
| 2 | AML—High Risk | 45 | 34 | 11 | 24.44 |
| 3 | AML—Low Risk | 54 | 25 | 29 | 53.70 |
| Total | 137 | 83 | 54 | 39.42 | |
PROC LIFETEST and most other analytical procedures apply the formats at the time that the data are read and mostly process strings that contain the formatted values, not the raw values. If you want to see the Unicode characters in the graph, you must circumvent this behavior and send the raw values and the format to ODS Graphics. There are two ways to do this. The first uses the GROUP= option, and the second modifies the data object.