Customizing the Kaplan-Meier Survival Plot
Using the GROUP= Option
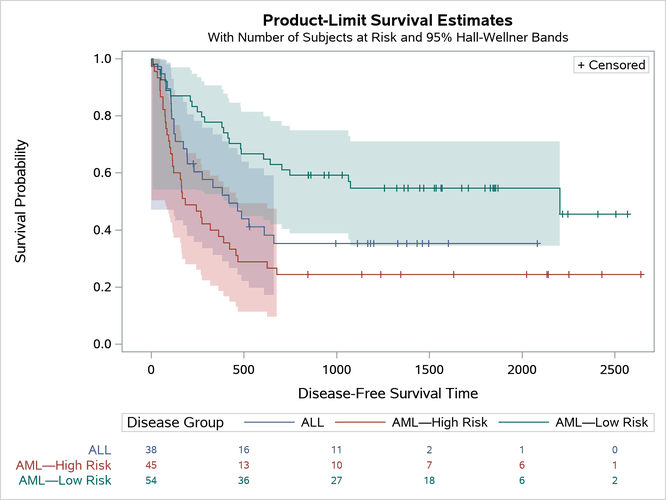
You can display the GROUP= variable in the graph. The following step illustrates:
proc lifetest data=sashelp.BMT plots=survival(cb=hw atrisk(outside maxlen=13));
   time T * Status(0);
   strata / group=Group;
   format group $dfmt.;
run;
Some of the results are displayed in Figure 41.
Figure 41: Select Output from Both PROC LIFETEST Runs
The LIFETEST Procedure
| Summary of the Number of Censored and Uncensored Values | |||||
|---|---|---|---|---|---|
| Stratum | Group | Total | Failed | Censored | Percent Censored |
| 1 | ALL | 38 | 24 | 14 | 36.84 |
| 1 | AML—High Risk | 45 | 34 | 11 | 24.44 |
| 1 | AML—Low Risk | 54 | 25 | 29 | 53.70 |
| Total | 137 | 83 | 54 | 39.42 | |
Last updated: March 08, 2022