Customizing the Kaplan-Meier Survival Plot
Multiple Strata Variables and Reformatting the Legend
This example reformats the Group variable from the Sashelp.BMT data set as follows to produce the same analysis from two strata variables:
data bmt;
   set sashelp.bmt;
   s1 = scan(group, 1, '-');
   s2 = scan(group, 2, '-');
   if s2 ne ' ' then s1 = cats(s1,'-');
   else              s2 = 'ALL';
run;

proc lifetest data=BMT plots=survival(cb=hw atrisk(outside maxlen=13));
   ods output survivalplot=sp;
   time T * Status(0);
   strata s1 s2;
run;
In practice, you would never create two strata variables from one. This is done here simply to illustrate the techniques for dealing with multiple strata variables in the context of a familiar example.
The graph in Figure 45 contains variable names and equal signs. You can reformat the values in any way that you choose. For example, if there were Unicode specifications in each variable, you could handle it this way.
Figure 45: Unicode in the Legend

The next step creates a new format that contains two Unicode specifications:
proc format;
   value $d2fmt '1: s1=ALL s2=ALL'= 'ALL'
                "2: s1=AML- s2=High Risk" =
                "AML (*ESC*){Unicode '2014'x} High(*ESC*){Unicode '2012'x}Risk"
                "3: s1=AML- s2=Low Risk"  =
                "AML (*ESC*){Unicode '2014'x} Low(*ESC*){Unicode '2012'x}Risk";

run;
The rest of this example proceeds as the previous example did. You begin by capturing the output data object and dynamic variables. Then you create the graph by using the new format. The only difference is that you need to change the value of the dynamic variable ClassAtRisk so that the formatted value is displayed to the left of the subjects-at-risk table in place of the stratum number.
ods document name=MyDoc (write);
proc lifetest data=BMT plots=survival(cb=hw atrisk(outside maxlen=16));
   ods output survivalplot=sp;
   time T * Status(0);
   strata s1 s2;
run;
ods document close;

proc document name=MyDoc;
   ods output dynamics=dynamics;
   obdynam \Lifetest#1\SurvivalPlot#1;
quit;

data _null_;
   set dynamics(where=(label1 ne '___NOBS___')) end=eof;
   if _n_ = 1 then
      call execute('proc sgrender data=sp
                    template=Stat.Lifetest.Graphics.ProductLimitSurvival2;
                    format stratum $d2fmt.;
                    dynamic');
   if label1 eq 'CLASSATRISK' then cvalue1 = 'Stratum';
   if cvalue1 ne ' ' then
      call execute(catx(' ', label1, '=',
                   ifc(n(nvalue1), cvalue1, quote(trim(cvalue1)))));
   if eof then call execute('; run;');
run;
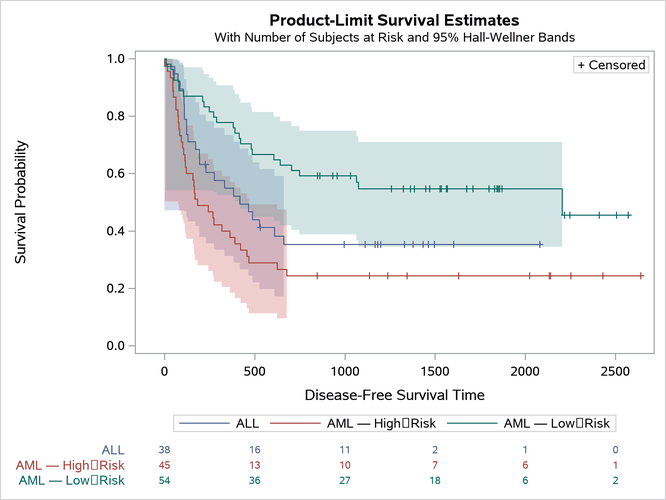
The graph is displayed in Figure 46.
Figure 46: Reformatted Legend
You can extend this example by specifying additional procedure options or by modifying the template. You can even add SG annotation.