The BOXPLOT Procedure
Saving Summary Data with Outliers
In a schematic box plot, outlier values within a group are plotted as separate points beyond the whiskers of the box-and-whiskers plot. See the section Styles of Box Plots and the description of the BOXSTYLE= option for a complete description of schematic box plots.
The following statements use the BOXSTYLE= option to produce a schematic box plot of the data from the Turbine data set. The OUTBOX= option creates a summary data set named OilSchematic.
title 'Schematic Box Plot for Power Output';
ods graphics on;
proc boxplot data=Turbine;
   plot KWatts*Day / boxstyle = schematic
                     outbox   = OilSchematic;
run;
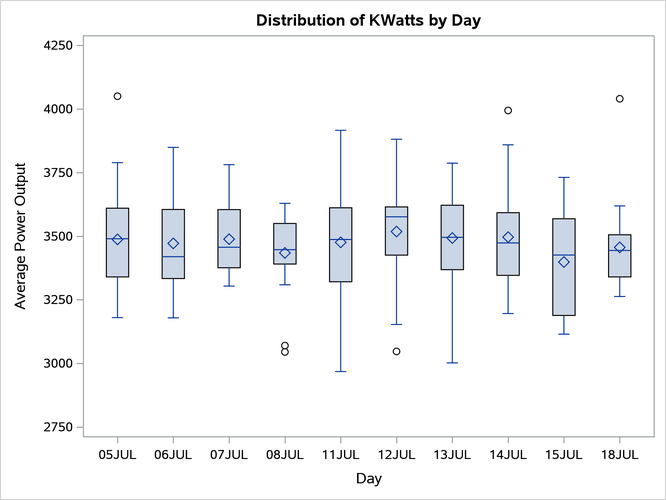
The schematic box plot is shown in Figure 4. Note the outliers plotted for several of the groups.
Figure 4: Schematic Box Plot of Power Output
Whereas the Oilsum data set from the section Creating Box Plots from Summary Data contains a variable for each summary statistic and one observation per group, the OUTBOX= data set OilSchematic contains one observation for each summary statistic in each group. The _TYPE_ variable identifies the statistic and the _VALUE_ variable contains its value. In addition, the OilSchematic data set contains an observation that records each outlier value for each group. Figure 5 shows a partial listing of the OilSchematic data set.
Figure 5: The Summary Data Set OilSchematic
| Schematic Box Plot for Power Output |
| Day | _VAR_ | _TYPE_ | _VALUE_ |
|---|---|---|---|
| 05JUL | KWatts | N | 20.00 |
| 05JUL | KWatts | MIN | 3180.00 |
| 05JUL | KWatts | Q1 | 3340.00 |
| 05JUL | KWatts | MEAN | 3487.40 |
| 05JUL | KWatts | MEDIAN | 3490.00 |
| 05JUL | KWatts | Q3 | 3610.00 |
| 05JUL | KWatts | MAX | 4050.00 |
| 05JUL | KWatts | STDDEV | 220.26 |
| 05JUL | KWatts | HIWHISKR | 3789.00 |
| 05JUL | KWatts | HIGH | 4050.00 |
| 06JUL | KWatts | N | 20.00 |
| 06JUL | KWatts | MIN | 3179.00 |
| 06JUL | KWatts | Q1 | 3333.50 |
| 06JUL | KWatts | MEAN | 3471.65 |
| 06JUL | KWatts | MEDIAN | 3419.50 |
| 06JUL | KWatts | Q3 | 3605.00 |
| 06JUL | KWatts | MAX | 3849.00 |
| 06JUL | KWatts | STDDEV | 210.43 |
| 07JUL | KWatts | N | 20.00 |
| 07JUL | KWatts | MIN | 3304.00 |
| 07JUL | KWatts | Q1 | 3376.00 |
| 07JUL | KWatts | MEAN | 3488.30 |
| 07JUL | KWatts | MEDIAN | 3456.50 |
| 07JUL | KWatts | Q3 | 3604.50 |
| 07JUL | KWatts | MAX | 3781.00 |
| 07JUL | KWatts | STDDEV | 147.02 |
| 08JUL | KWatts | N | 20.00 |
| 08JUL | KWatts | MIN | 3045.00 |
| 08JUL | KWatts | Q1 | 3390.50 |
| 08JUL | KWatts | MEAN | 3434.20 |
| 08JUL | KWatts | MEDIAN | 3447.00 |
| 08JUL | KWatts | Q3 | 3550.00 |
| 08JUL | KWatts | MAX | 3629.00 |
| 08JUL | KWatts | STDDEV | 157.64 |
| 08JUL | KWatts | LOWHISKR | 3309.00 |
| 08JUL | KWatts | LOW | 3070.00 |
| 08JUL | KWatts | LOW | 3045.00 |
| 11JUL | KWatts | N | 20.00 |
| 11JUL | KWatts | MIN | 2968.00 |
| 11JUL | KWatts | Q1 | 3321.00 |
Observations with the _TYPE_ variable values "HIGH" and "LOW" contain outlier values. If you want to use a summary data set to re-create a schematic box plot, you must create an OUTBOX= data set in order to save the outlier data.