Introduction to Clustering Procedures
Well-Separated Clusters
(View the complete code for this example.)
If the population clusters are sufficiently well separated, almost any clustering method performs well, as demonstrated in the following example, which uses single linkage. In this and subsequent examples, the output from the clustering procedures is not shown, but cluster membership is displayed in scatter plots. The following SAS statements produce Figure 1:
data compact;
   keep x y;
   n=50; scale=1;
   mx=0; my=0; link generate;
   mx=8; my=0; link generate;
   mx=4; my=8; link generate;
   stop;
generate:
   do i=1 to n;
      x=rannor(1)*scale+mx;
      y=rannor(1)*scale+my;
      output;
   end;
   return;
run;
proc cluster data=compact outtree=tree method=single noprint;
run;

proc tree noprint out=out n=3;
   copy x y;
run;

ods graphics on / attrpriority=none;

proc sgplot noautolegend;
   title 'Single Linkage Cluster Analysis: '
         'Well-Separated, Compact Clusters';
   scatter y=y x=x / group=cluster;
   keylegend / location=inside position=topright sortorder=ascending
               across=1 noopaque title='';
run;
Figure 1: Well-Separated, Compact Clusters: PROC CLUSTER METHOD=SINGLE
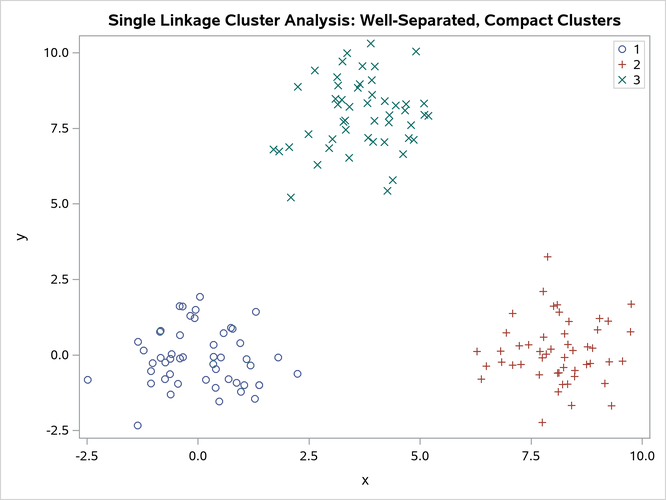
The ATTRPRIORITY=NONE option in the ODS GRAPHICS statement differentiates clusters by both marker shape and color. By default, ATTRPRIORITY=COLOR; so the default markers are circles and clusters are differentiated only by colors.
Last updated: December 09, 2022