Introduction to Power and Sample Size Analysis
Basic Graphs (PROC POWER, PROC GLMPOWER, and Power and Sample Size Tasks in SAS Studio)
If you include a PLOT statement, the GLMPOWER and POWER procedures produce standard power curves, which represent any multivalued input parameters that have varying line styles, symbols, colors, panels, or any combination of these. The power and sample size tasks in SAS Studio also provide options that enable you to produce power curves. If ODS Graphics is enabled, then graphs are created using ODS Graphics; otherwise, traditional graphs are produced.
To display default power curves for the preceding PROC POWER call, add the PLOT statement with no arguments as follows:
ods graphics on;

proc power plotonly;
   twosamplemeans test=diff
      meandiff = 5 6
      stddev = 12 18
      alpha = 0.05 0.1
      ntotal = 100 200
      power = .;
   plot;
run;

ods graphics off;
The ODS GRAPHICS ON statement enables ODS Graphics.
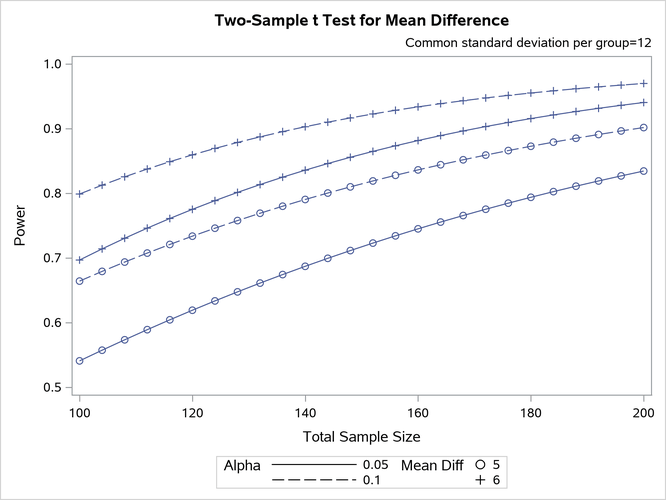
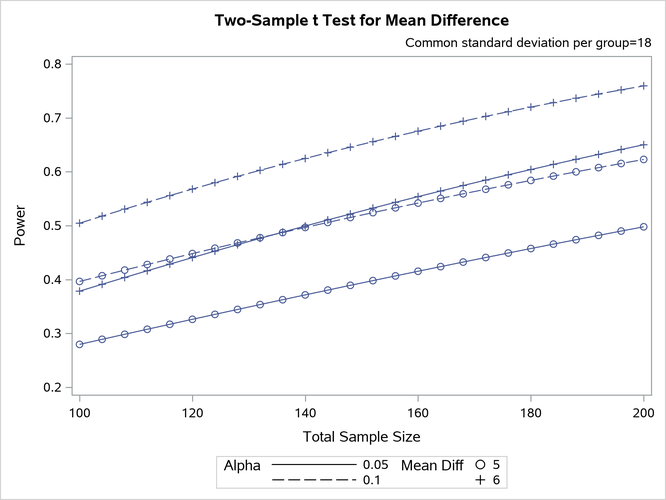
Figure 2 shows the results. Note that the line style varies by the significance level  , the symbol varies by the mean difference, and the panel varies by standard deviation.
Figure 2: PROC POWER Default Graphical Output