Customizing the Kaplan-Meier Survival Plot
Individual Survival Plots
You can use the STRATA=INDIVIDUAL option to request individual survival plots. By default, the STRATA=OVERLAY option produces the plot of overlaid step functions displayed in Figure 1. You can run the same analysis but request the results in three separate graphs, one per patient group, as follows:
proc lifetest data=sashelp.BMT plots=survival(strata=individual);
   time T * Status(0);
   strata Group;
run;
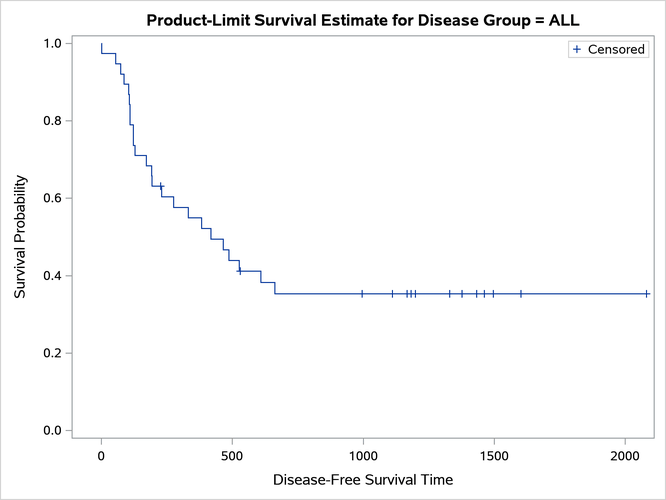
The first of the three survival plots is displayed in Figure 2. To conserve space, the other graphs are not displayed.
Figure 2: One of Three Individual Plots
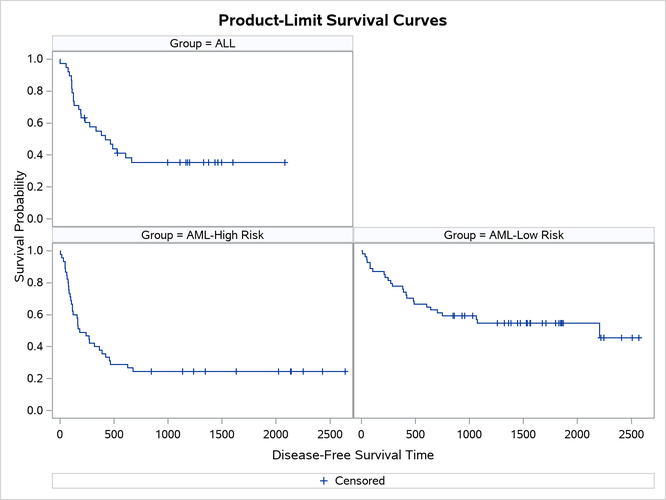
You can use the STRATA=PANEL option as follows to display the results in separate panels of a single graphical display:
proc lifetest data=sashelp.BMT plots=survival(strata=panel);
   time T * Status(0);
   strata Group;
run;
The results are displayed in Figure 3.
Figure 3: Individual Plots Displayed in a Panel
The rest of this chapter discusses overlaid plots such as the one displayed in Figure 1.