Customizing the Kaplan-Meier Survival Plot
Failure Plots
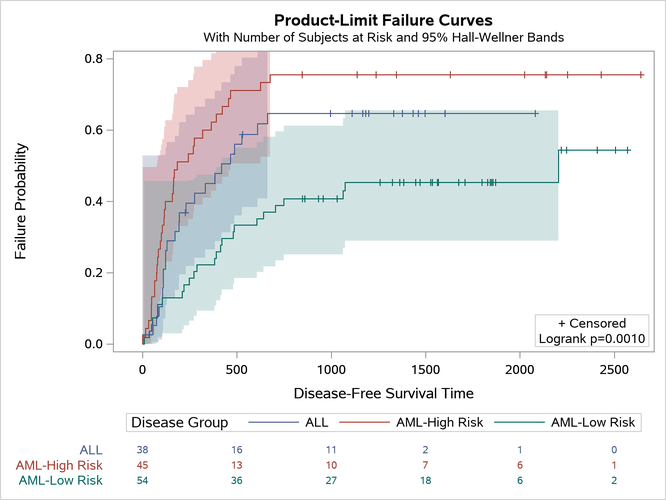
All the discussion up to this point has been about survival plots. You can instead plot failure probabilities by using the PLOTS=SURVIVAL(FAILURE) option as follows:
proc lifetest data=sashelp.BMT
     plots=survival(cb=hw failure test atrisk(maxlen=13));
   time T * Status(0);
   strata Group;
run;
The results are displayed in Figure 16.
Figure 16: Failure Plot
The section Controlling the Survival Plot by Modifying Graph Templates provides macros for customizing the survival plot. That is the only plot in SAS that has customization macros. If you want to customize the failure plot or other plots, you might need to directly modify the graph template. The rest of this example shows how to programmatically modify the template for the failure plot by using a DATA step. This technique of writing a DATA step to modify a template was introduced by Kuhfeld (2015).
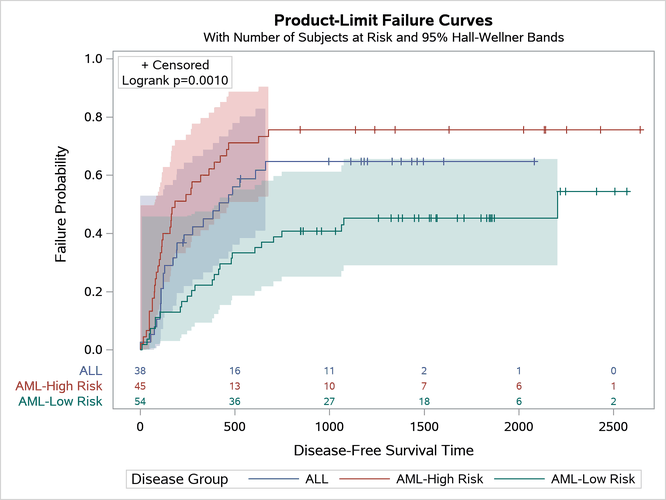
Customizing the Failure Plot Y Axis
This example shows how to display a Y axis that ranges from 0 to 0.8 instead of the customary 0 to 1. You begin by enabling ODS TRACE output and running the procedure. This step, unlike the preceding step, displays the at-risk table outside the graph.
ods trace on;
proc lifetest data=sashelp.BMT
   plots=survival(cb=hw failure test atrisk(outside maxlen=13));
   time T * Status(0);
   strata Group;
run;
The graph is displayed in Figure 17. It has the full Y-axis range of 0 to 1.
Figure 17: Failure Plot with At-Risk Table Outside
The output from the ODS TRACE ON statement (not displayed here) shows that the name of the graph template is Stat.Lifetest.Graphics.ProductLimitFailure2. You can write to a file the template that SAS provides for the failure plot by submitting the following step:
proc template;
   delete Stat.Lifetest.Graphics.ProductLimitFailure2;
   source Stat.Lifetest.Graphics.ProductLimitFailure2 / file='tpl.tpl';
quit;
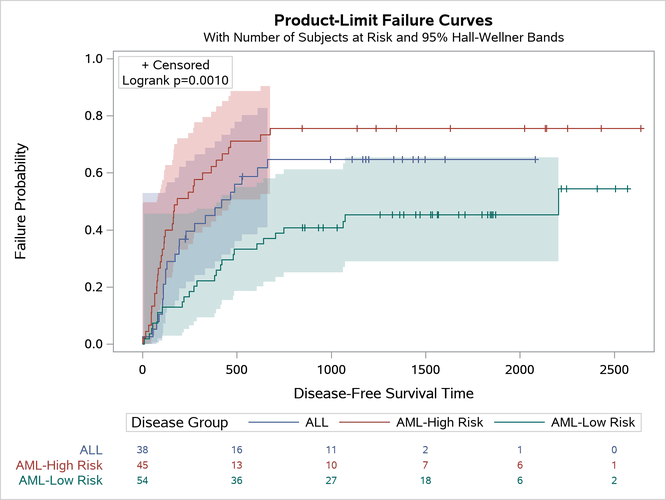
The DELETE statement deletes any compiled templates that might be left from previous template modifications. The SOURCE statement writes the template to the file tpl.tpl. You might need to name your files differently, depending on your operating system and how you run SAS. You can use an editor to read the template, and then you can use a DATA step to modify it and change the Y-axis maximum. The option that you need to change is the VIEWMAX= option. You also need to submit a PROC TEMPLATE statement before submitting the template definition. Finally, you can submit a QUIT statement, although this is not required. You can do all this by submitting the following step:
data _null_;                                        /* Standard boilerplate   */
   infile 'tpl.tpl' end=eof;                        /* Standard boilerplate   */
   input;                                           /* Standard boilerplate   */
   if _n_ eq 1 then call execute('proc template;'); /* Standard boilerplate   */
   _infile_ = tranwrd(_infile_, 'viewmax=1',        /* Customization: var =   */
                                'viewmax=0.8');     /* tranwrd(var, from, to);*/
   call execute(_infile_);                          /* Standard boilerplate   */
   if eof then call execute('quit;');               /* Standard boilerplate   */
run;                                                /* Standard boilerplate   */
You are not required to specify variables in the INPUT statement. When you are processing text files, it is often convenient to instead use the automatic input buffer variable, _Infile_. The TRANWRD function does the translation and replaces the VIEWMAX= option. You must look at the original template to know how to write translation assignment statements. The CALL EXECUTE statements submit all the template code to a code buffer. SAS runs the program that is stored in the code buffer when the DATA step finishes. If you want to make different template modifications, you need to replace only the assignment statement. The rest of the DATA step remains the same. You can view the modified template by submitting the following statements:
proc template;
   source Stat.Lifetest.Graphics.ProductLimitFailure2 / store=sasuser.templat;
quit;
The SOURCE statement explicitly references the compiled template that is stored in the templat item store in the Sasuser library. Alternatively, you can write the modified template to a file, as in the following code, and then use a text comparison utility to see the changes between tpl.tpl and tplmod.tpl:
proc template;
   source Stat.Lifetest.Graphics.ProductLimitFailure2 /
     store=sasuser.templat file='tplmod.tpl';
quit;
The following step runs PROC LIFETEST, which uses the modified template:
proc lifetest data=sashelp.BMT
   plots=survival(cb=hw failure test atrisk(outside maxlen=13));
   time T * Status(0);
   strata Group;
run;
The graph is displayed in Figure 18.
Figure 18: Restricted Axis Range
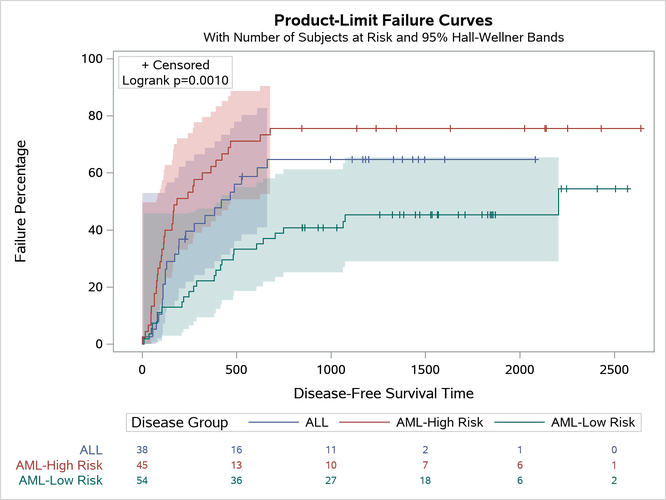
Converting the Y-Axis Scale to Percentages
The following steps continue using the tpl.tpl file, but this time they convert the Y-axis scale to percentages:
data _null_;
   infile 'tpl.tpl' end=eof;
   input;
   if _n_ eq 1 then call execute('proc template;');
   _infile_ = tranwrd(_infile_, 'viewmax=1', 'viewmax=100');
   _infile_ = tranwrd(_infile_, 'tickvaluelist=(0 .2 .4 .6 .8 1.0)',
                     'tickvaluelist=(0 20 40 60 80 100)');
   _infile_ = tranwrd(_infile_, '1-', '100-100*');
   _infile_ = tranwrd(_infile_, 'Failure Probability', 'Failure Percentage');
   call execute(_infile_);
   if eof then call execute('quit;');
run;

proc lifetest data=sashelp.BMT
   plots=survival(cb=hw failure test atrisk(outside maxlen=13));
   time T * Status(0);
   strata Group;
run;
The tpl.tpl file was not changed by the previous customization, so you can process it again to perform a new template modification. The DATA step changes the option VIEWMAX=1 to VIEWMAX=100; changes the tick values to range from 0 to 100; and changes the expression for many Y-axis options, such as Y=EVAL(1–SURVIVAL) in the STEPPLOT statement, to Y=EVAL(100–100*SURVIVAL). The output data object variables for the Y axis are on a survival scale of 0 to 1. Subtracting the Y value from 1 transforms the scale to a failure scale. Subtracting 100 times the survival value from 100 converts the scale to a percentage scale. Finally, the DATA step changes the Y-axis label. Again, you cannot write code like this without first looking at the template that is stored in the tpl.tpl file. For example, you must correctly specify the case and spacing when you specify the string that is to be translated. The graph is displayed in Figure 19.
Figure 19: Percentages on the Y Axis