Customizing the Kaplan-Meier Survival Plot
Changing the Line Pattern
Begin by including the macros that you copied in the section The Modularized Templates.
You can change the line patterns as follows:
%ProvideSurvivalMacros

%let GraphOpts = attrpriority=none
                 DataLinePatterns=(ShortDash MediumDash LongDash);

%CompileSurvivalTemplates

proc lifetest data=sashelp.BMT
              plots=survival(cb=hw test atrisk(outside maxlen=13));
   time T * Status(0);
   strata Group;
run;
The results are displayed in Figure 25.
Figure 25: Changing the Line Patterns
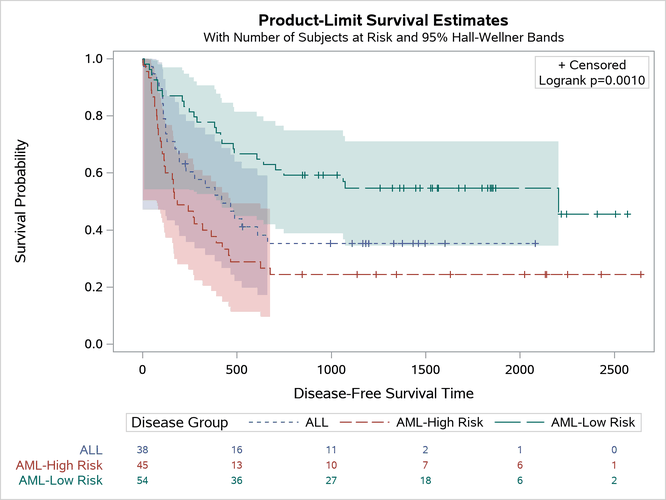
Other values for the DATALINEPATTERNS= option are provided in the section The Macro Variables. You must use the option ATTRPRIORITY=NONE when you want to have varying line patterns in an ATTRPRIORITY=COLOR style like HTMLBlue or Pearl. In an ATTRPRIORITY=COLOR style, groups are not distinguished by line patterns, and the line patterns for second and subsequent groups match the line pattern for the first group.
Last updated: December 09, 2022