Customizing the Kaplan-Meier Survival Plot
Adding a Y-Axis Reference Line
Begin by including the macros that you copied in the section The Modularized Templates.
You can add a horizontal reference line to the survival plot by adding the following statement to the template:
referenceline y=0.5;
You can do this by using the %StmtsTop macro. By default, this macro is empty. You can use the %StmtsTop macro to add new statements to the beginning of the block of statements that define the appearance of the graph. In contrast, you can use the %StmtsBottom macro to provide statements at the end of the statement block. ODS Graphics draws statements in the order in which they appear; therefore, reference lines should be drawn first so they do not obscure other parts of the graph.
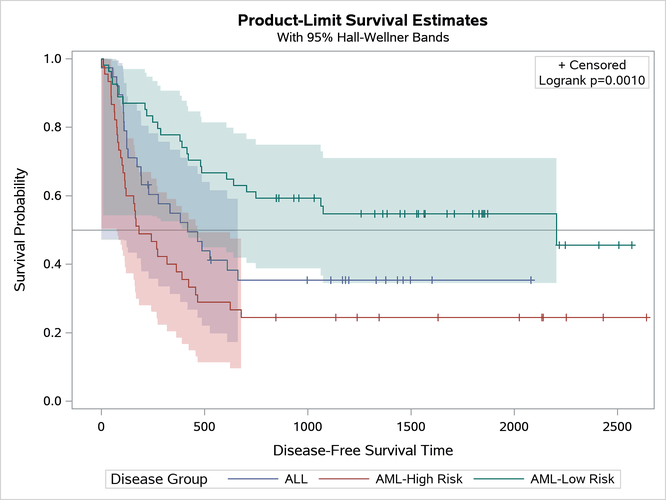
The following step creates the plot in Figure 29:
%ProvideSurvivalMacros
%macro StmtsTop;
   referenceline y=0.5;
%mend;
%CompileSurvivalTemplates

proc lifetest data=sashelp.BMT plots=survival(cb=hw test);
   time T * Status(0);
   strata Group;
run;
Figure 29: Horizontal Reference Line