Customizing the Kaplan-Meier Survival Plot
Adding a Custom Header above the At-Risk Table
Begin by including the macros that you copied in the section The Modularized Templates.
The following steps add a header to the at-risk table by using the %StmtsBeginGraph macro and a DRAWTEXT statement:
%ProvideSurvivalMacros
%macro StmtsBeginGraph;
* Coordinates are ad hoc, and there are many available coordinate systems.
See the documentation for more information.;
drawtext textattrs=(weight=Bold) 'Number at Risk' / x=5 y=14 width=9;
%mend;
%CompileSurvivalTemplates
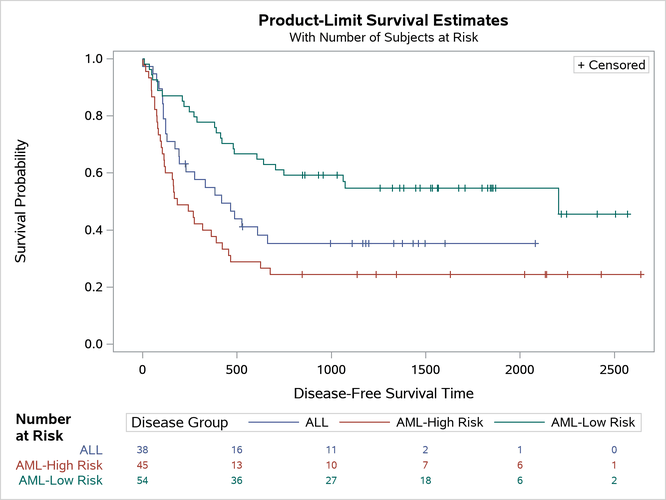
proc lifetest data=sashelp.BMT plots=survival(atrisk outside maxlen=13);
time T * Status(0);
strata Group;
run;
The %StmtsBeginGraph macro adds statements near the top of the template. The DRAWTEXT statement adds text to the graph. The width of 9% was chosen so that the header would break between Number and at Risk. The other statements in the DRAW family include BEGINPOLYGON, BEGINPOLYLINE, DRAWARROW, DRAWIMAGE, DRAWLINE, DRAWOVAL, and DRAWRECTANGLE. They provide the same capabilities in graph templates that SG annotation provides in the SG procedures. For more information, see SAS Graph Template Language: User’s Guide.
Figure 34: At-Risk Table Header