Customizing the Kaplan-Meier Survival Plot
Displaying Percentages on the Y Axis
Begin by including the macros that you copied in the section The Modularized Templates.
There might be times when you want to use the customization macros and perform a subsequent template modification. If you want to make all the changes that appear in Figure 38 and display percentages on the Y axis, then you can modify the already-modified template. If you want to display only percentages, then you can omit the first round of template modifications. Begin by making the following template modifications, as in the section Kaplan-Meier Plot with Event Table and Other Customizations:
proc format;
   invalue bmtnum 'ALL' = 1  'AML-Low Risk' = 2  'AML-High Risk' = 3;
   value   bmtfmt 1 = 'ALL'  2 = 'AML-Low Risk'  3 = 'AML-High Risk';
run;

data BMT(drop=g);
   set sashelp.BMT(rename=(group=g));
   Group = input(g, bmtnum.);
run;

%ProvideSurvivalMacros

%let TitleText2 = "Kaplan-Meier Plot";
%let nTitles    = 1;
%let GraphOpts  = DesignHeight=500px;
%let LegendOpts = ;
%let InsetOpts  = ;

%SurvivalSummaryTable

%CompileSurvivalTemplates
Next, write the modified template to a file:
proc template;
   source Stat.Lifetest.Graphics.ProductLimitSurvival / file='temp.tmp';
quit;
A subsequent step reads the file, inserts a PROC TEMPLATE statement at the beginning, and inserts a QUIT statement at the end. Then it modifies several statements in between. Before seeing how it makes those modifications, you should look at the file temp.tmp and find the code that needs to be modified. The following are samples of the statement fragments that need to be modified:
yaxisopts=(label="Survival Probability"
linearopts=(viewmin=0 viewmax=1
tickvaluelist=(0 .2 .4 .6 .8 1.0)));
bandplot LimitUpper=EP_UCL LimitLower=EP_LCL x=TIME
bandplot LimitUpper=HW_UCL LimitLower=HW_LCL x=TIME
scatterplot y=CENSORED x=TIME
stepplot y=SURVIVAL x=TIME
Each of these statement fragments occurs in more than one place. There are ten BANDPLOT statements and two each of the SCATTERPLOT and STEPPLOT statements. You need to change Survival Probability to Survival Percentage, VIEWMAX=1 to VIEWMAX=100, and the tick value list from proportions to percentages. Finally, you need to change all the Y-axis variables (which are specified in many statements) from proportions to percentages by specifying an expression. For example, you need to change LimitUpper=EP_UCL LimitLower=EP_LCL to LimitUpper=eval(100*EP_UCL) LimitLower=eval(100*EP_LCL). The following step makes all these changes:
data _null_;
   length var stmt $ 32;
   infile 'temp.tmp' end=eof;
   input;
   if _n_ eq 1 then call execute('proc template;');
   stmt = scan(_infile_, 1);
   if stmt in ('scatterplot', 'stepplot', 'bandplot') then do;
      var = scan(scan(_infile_, 2, '='), 1);
      _infile_ = tranwrd(_infile_, trim(var), cats('eval(100*',var,')'));
      if stmt = 'bandplot' then do;
         var = scan(scan(_infile_, 3, '='), 1);
         _infile_ = tranwrd(_infile_, trim(var), cats('eval(100*',var,')'));
      end;
   end;
   _infile_ = tranwrd(_infile_, 'Survival Probability', 'Survival Percentage');
   _infile_ = tranwrd(_infile_, '0 .2 .4 .6 .8 1.0', '0 20 40 60 80 100');
   _infile_ = tranwrd(_infile_, 'viewmax=1', 'viewmax=100');
   call execute(_infile_);
   if eof then call execute('quit;');
run;
Statements in this DATA step begin by doing the following: read the template from the file, submit a PROC TEMPLATE statement to a buffer, find the name of each statement, and find the name of the first variable (which for this template is always a Y-axis variable). The DATA step scans for the second string by using an equal sign as a delimiter and then scans that result for the first string by using the standard delimiters (which include blanks). This step extracts only the variable name that follows the equal sign. The TRANWRD function changes the variable name to an expression. Band plots have two Y-axis specifications (for the upper and lower limits), so the next code block makes the same change to the second specification. The final TRANWRD functions change the Y-axis label, the tick values, and the maximum Y-axis value. The second-last CALL EXECUTE statement submits to a buffer all the template statements, including the modified statements. At the end, the DATA step submits a QUIT statement to the buffer. When the DATA step finishes, SAS submits all the code in the buffer, which modifies the template. The following step uses the modified template and creates a plot that has percentages on the Y axis:
proc lifetest data=BMT plots=survival(cb=hw atrisk(maxlen=13));
   time T * Status(0);
   strata Group / order=internal;
   format group bmtfmt.;
run;
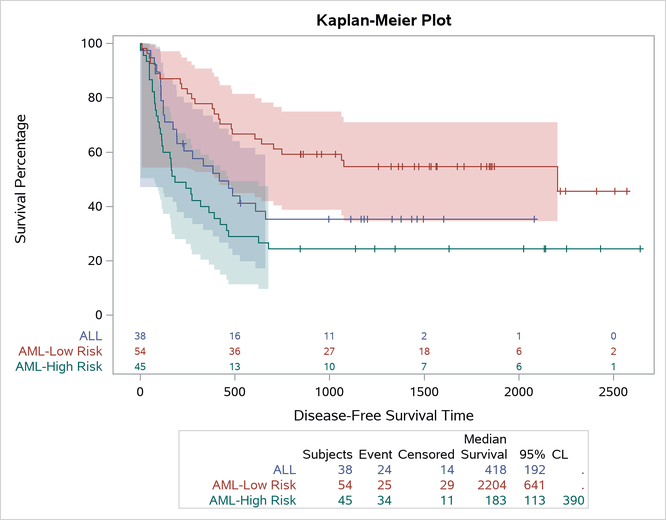
The graph is displayed in Figure 39.
Figure 39: Survival Percentages