Statistical Graphics Using ODS
Attribute Priority and Overriding How Groups Are Distinguished
ODS styles have an ATTRPRIORITY= option with the specification ATTRPRIORITY='Color' or ATTRPRIORITY='None'. The ODS GRAPHICS statement has an ATTRPRIORITY= option with the specification ATTRPRIORITY=COLOR or ATTRPRIORITY=NONE. The default attribute priority for the style option is 'None'. The default attribute priority for the ODS GRAPHICS statement option is the attribute priority from the style. The ODS styles that distinguish groups by color alone are ATTRPRIORITY='Color' styles. The ODS styles that distinguish groups by varying colors, markers, and line patterns are ATTRPRIORITY='None' styles. The ATTRPRIORITY='Color' styles include HTMLBLUE, PEARL, PEARLJ, and SAPPHIRE. Most other styles are ATTRPRIORITY='None' styles. (For more information about styles and attribute priority, see the section ODS Styles.) You can override the ATTRPRIORITY= option in all styles by specifying one of the following statements:
ods graphics on / attrpriority=color;
ods graphics on / attrpriority=none;
You can reset the default ODS Graphics options as follows:
ods graphics on / reset;
The following steps illustrate three ways to make graphs and create the graphs in Figure 15:
ods graphics on / attrpriority=color;
proc sgplot data=sashelp.class;
   title 'Attribute Priority = Color';
   reg y=weight x=height / group=sex;
   keylegend / location=inside position=topleft across=1;
run;

ods graphics on / attrpriority=none;
proc sgplot data=sashelp.class;
   title 'Attribute Priority = None';
   reg y=weight x=height / group=sex;
   keylegend / location=inside position=topleft across=1;
run;

proc sgplot data=sashelp.class;
   title 'Solid Lines but Varying Markers';
   styleattrs datalinepatterns=(solid);
   reg y=weight x=height / group=sex;
   keylegend / location=inside position=topleft across=1;
run;
ods graphics on / reset;
Figure 15: Attribute Priority
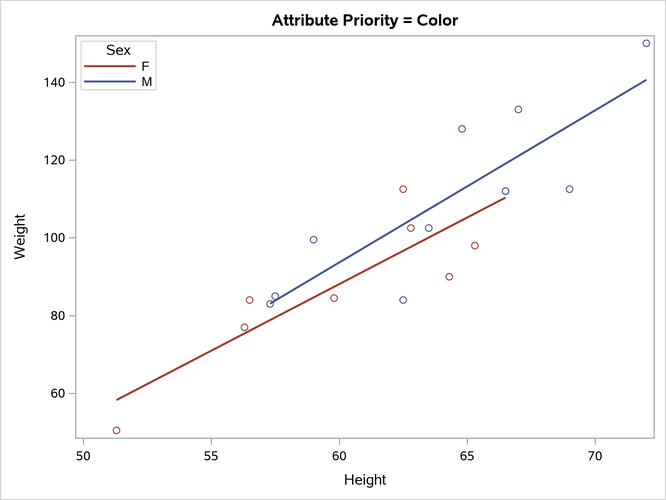
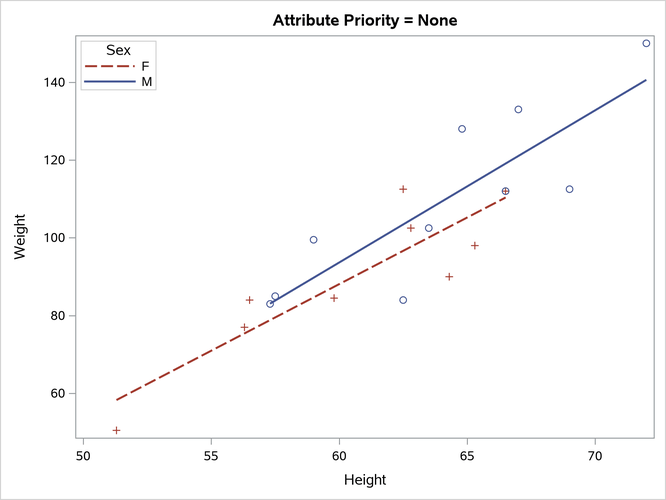
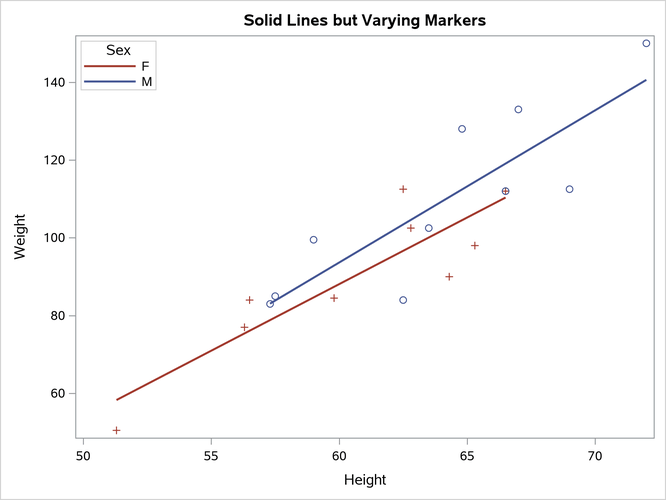
The settings that are shown in the last graph, which has solid lines but varying markers, often work well when there are multiple groups. You might not need to vary the line style, but varying the markers makes it easier to distinguish the points. For example, it is easy to see in the last two graphs that one point corresponds to both a male and a female point.
You can modify the attribute priority in any style by specifying the ATTRPRIORITY= option, as in the following examples:
proc template;
   define style styles.Default;
      parent = styles.default;
      style Graph from Graph / attrpriority = "Color";
   end;
   define style styles.HTMLBlue;
      parent = styles.HTMLBlue;
      style Graph from Graph / attrpriority = "None";
   end;
run;
You can delete the modified style templates as follows:
proc template;
   delete styles.Default  / store=sasuser.templat;
   delete styles.HTMLBlue / store=sasuser.templat;
run;
In the statistical graphics (SG) procedures, you can override the style attributes and modify how you distinguish groups by using the STYLEATTRS statement:
ods graphics on / attrpriority=none;

proc sgplot data=sashelp.iris;
   title 'Fisher (1936) Iris Data';
   styleattrs datasymbols=(circlefilled squarefilled starfilled)
              datacontrastcolors=(red green blue);
   scatter x=petallength y=petalwidth / group=species markerattrs=(size=5px);
run;

ods graphics / reset;
The results are displayed in Figure 16.
Figure 16: Iris Data
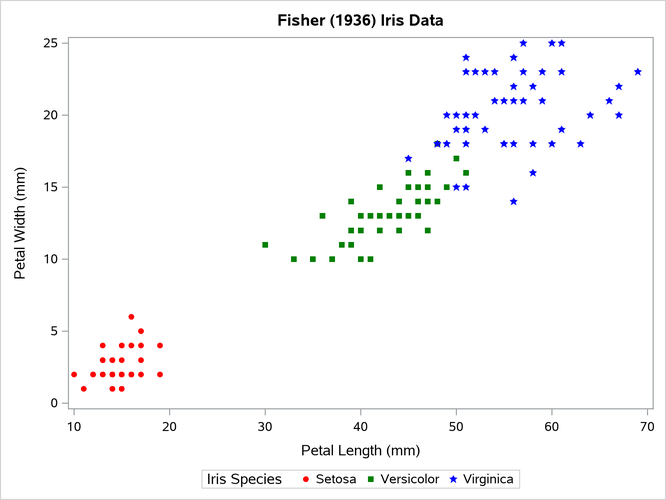
Note: Specifying more than one value in a STYLEATTRS statement option list works only when the attribute priority is 'None'. The STYLEATTRS statement overrides the default style elements, but it does not force the style elements GraphData2, GraphData3, and so on to be used.
The STYLEATTRS statement options are as follows:
In the SG procedures, you can override the style attributes and modify how groups are distinguished by using attribute maps:
data myattrmap;
retain ID 'Attr1' MarkerSymbol 'CircleFilled';
input Value $ LineColor $ 3-11 MarkerColor $ 13-20;
datalines;
F pink cxFFCCEE
M lightblue blue
;
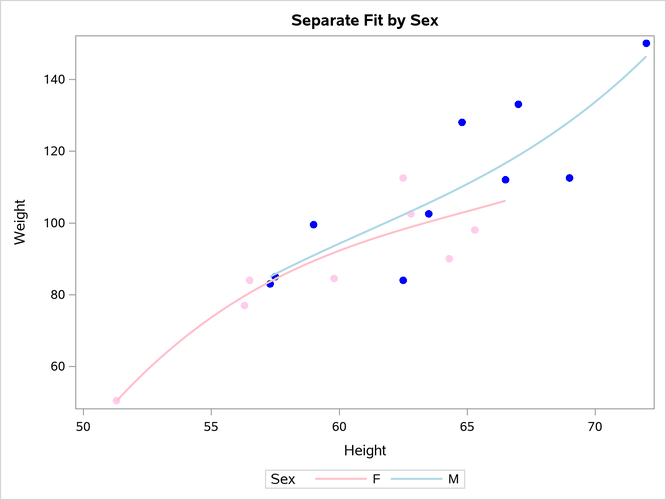
proc sgplot data=sashelp.class dattrmap=myattrmap;
title 'Separate Fit by Sex';
reg y=weight x=height / group=sex degree=3 attrid=Attr1;
run;
The results are displayed in Figure 17.
Figure 17: Color Changes with an Attribute Map
You can set the following variables and values in the PROC SGPLOT DATTRMAP=SAS-data-set option:
FillColorcolor or style attribute
FillStylestyle element
IDtext string that contains the attribute map ID
LineColorcolor or style attribute
LinePatternline pattern or style attribute
LineStylestyle element
MarkerColorcolor or style attribute
MarkerStylestyle element
MarkerSymbolsymbol name or style attribute
Valuetext string that contains the group