Statistical Graphics Using ODS
The SGPLOT Procedure
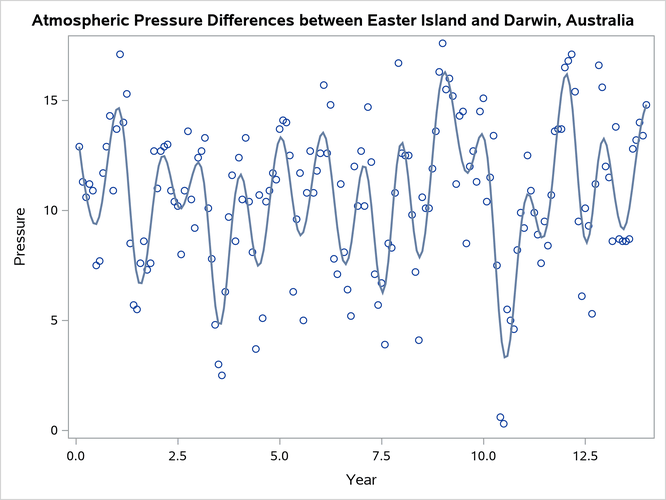
PROC SGPLOT provides a simple way to make a variety of scatter plots. This example is taken from Example 78.4 in Chapter 78, The LOESS Procedure. The ENSO data set, which contains information about differences in ocean pressure over time, is available from the Sashelp library.
The following statements create a scatter plot of points along with a penalized B-spline fit to the data and produce Figure 72:
proc sgplot data=sashelp.enso noautolegend;
   title 'Atmospheric Pressure Differences between '
         'Easter Island and Darwin, Australia';
   pbspline y=pressure x=year;
run;
Figure 72: Penalized B-Spline Fit with PROC SGPLOT
For more information about penalized B-splines, see Chapter 126, The TRANSREG Procedure. Also see the section Grouped Scatter Plot with PROC SGPLOT and Figure 12 for an example of a scatter plot that has groups of observations.
Last updated: December 09, 2022