Statistical Graphics Using ODS
PROC ADAPTIVEREG
The ADAPTIVEREG procedure fits multivariate adaptive regression splines (Friedman 1991). Multivariate adaptive regression splines extend linear models to analyze nonlinear dependencies and produce parsimonious models that do not overfit the data and thus have good predictive power. This method is a nonparametric regression technique that combines both regression splines and model selection. It constructs spline basis functions in an adaptive way by automatically selecting appropriate knot values for different variables, and it obtains reduced models by applying model selection techniques. The method does not assume parametric model forms and does not require specification of knot values. For more information about PROC ADAPTIVEREG, see Kuhfeld and Cai (2013) and Chapter 28, The ADAPTIVEREG Procedure. The following step displays the results in Output 24.6.34:
proc adaptivereg data=sashelp.gas plots=all details=bases;
   class fuel;
   model nox = eqratio | fuel;
run;
Output 24.6.34: Grouped Fit Function, Fit Statistics, and Plot
| Basis Information | |
|---|---|
| Name | Transformation |
| Basis0 | 1 |
| Basis1 | Basis0*MAX(EqRatio - 0.915,0) |
| Basis2 | Basis0*MAX( 0.915 - EqRatio,0) |
| Basis3 | Basis0*(Fuel = 'Indolene' OR Fuel = '82rongas' OR Fuel = 'Gasohol' OR Fuel = 'Ethanol') |
| Basis4 | Basis0*NOT(Fuel = 'Indolene' OR Fuel = '82rongas' OR Fuel = 'Gasohol' OR Fuel = 'Ethanol') |
| Basis5 | Basis0*(Fuel = 'Ethanol') |
| Basis6 | Basis0*NOT(Fuel = 'Ethanol') |
| Basis7 | Basis6*MAX(EqRatio - 0.808,0) |
| Basis8 | Basis6*MAX( 0.808 - EqRatio,0) |
| Basis9 | Basis4*MAX(EqRatio - 0.827,0) |
| Basis10 | Basis4*MAX( 0.827 - EqRatio,0) |
| Basis11 | Basis3*MAX(EqRatio - 1.144,0) |
| Basis12 | Basis3*MAX( 1.144 - EqRatio,0) |
| Basis13 | Basis0*MAX(EqRatio - 0.954,0) |
| Basis14 | Basis0*MAX( 0.954 - EqRatio,0) |
| Basis15 | Basis6*MAX(EqRatio - 1.128,0) |
| Basis16 | Basis6*MAX( 1.128 - EqRatio,0) |
| Basis17 | Basis3*MAX(EqRatio - 0.693,0) |
| Basis18 | Basis3*MAX( 0.693 - EqRatio,0) |
| Basis19 | Basis0*MAX(EqRatio - 0.846,0) |
| Basis20 | Basis0*MAX( 0.846 - EqRatio,0) |
| Regression Spline Model after Backward Selection | |||||
|---|---|---|---|---|---|
| Name | Coefficient | Parent | Variable | Knot | Levels |
| Basis0 | 2.8148 | Intercept | |||
| Basis2 | -5.0396 | Basis0 | EqRatio | 0.9150 | |
| Basis3 | 1.8016 | Basis0 | Fuel | 4 0 3 2 | |
| Basis5 | -2.2310 | Basis0 | Fuel | 2 | |
| Basis7 | -7.2268 | Basis6 | EqRatio | 0.8080 | |
| Basis8 | -13.5265 | Basis6 | EqRatio | 0.8080 | |
| Basis9 | 19.3139 | Basis4 | EqRatio | 0.8270 | |
| Basis10 | 7.5643 | Basis4 | EqRatio | 0.8270 | |
| Basis11 | 13.6667 | Basis3 | EqRatio | 1.1440 | |
| Basis13 | -17.0561 | Basis0 | EqRatio | 0.9540 | |
| Basis15 | 7.4962 | Basis6 | EqRatio | 1.1280 | |
| Basis17 | 8.9758 | Basis3 | EqRatio | 0.6930 | |
| Basis19 | -7.8762 | Basis0 | EqRatio | 0.8460 | |
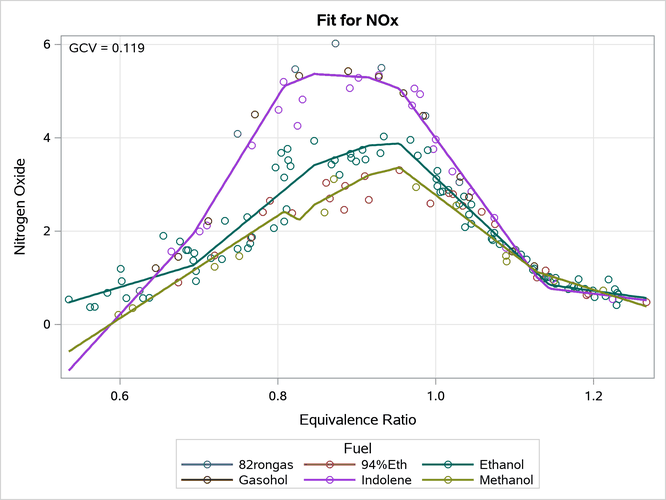
It is obvious from the plot in Output 24.6.34 that this analysis is different from those shown previously. Three splines are displayed even though there are still six types of fuel. Also, the functions are not smooth; they are piecewise linear. The first table shows that the terms that can enter the model include the following:
Basis0is an intercept.
Basis1is a linear truncated power function with a knot at 0.915. Like a hockey stick, this term is flat (0) up through 0.915 and then linearly increases as x increases beyond 0.915.
Basis2is a linear truncated power function with a knot at 0.915. Like a reflection of the preceding hockey stick, this term linearly decreases as x increases to 0.915 and is flat (0) beyond 0.915.
Basis3is a binary variable that is constructed by combining levels of the CLASS variable.
Basis4is 0 when
Basis3is 1 and 0 otherwise.Basis5is a binary variable that corresponds to the
Ethanollevel of the CLASS variable.Basis6is 0 when
Basis5is 1 and 0 otherwise.
The remaining terms are interactions of preceding terms and other hockey-stick functions. Forward and backward selection creates a final model, which consists of a subset of the full set of basis functions. A model such as this, which is less smooth and treats groups of fuels the same, is likely to do better in scoring additional observations than a model that has more parameters (as many of the models shown previously have).