ODS Graphics Template Modification
PROC LOGISTIC Example
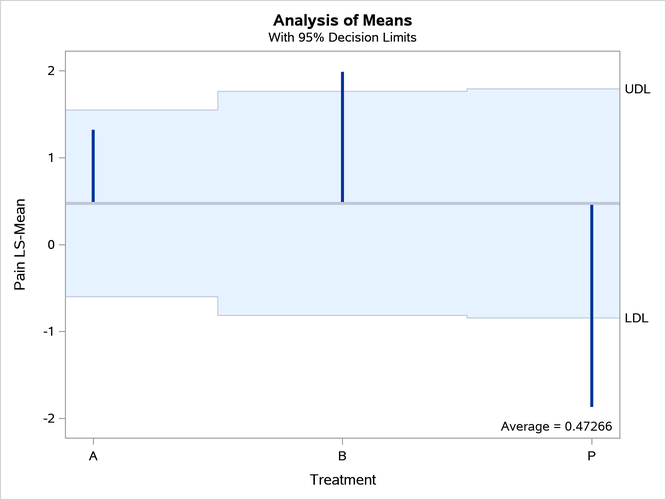
The following steps run PROC LOGISTIC and create an analysis-of-means plot:
data Neuralgia;
   input Treatment $ Sex $ Age Duration Pain $ @@;
   datalines;
P F 68 1 No B M 74 16 No P F 67 30 No P M 66 26 Yes B F 67 28 No B F 77 16 No A
F 71 12 No B F 72 50 No B F 76 9 Yes A M 71 17 Yes A F 63 27 No A F 69 18 Yes B
F 66 12 No A M 62 42 No P F 64 1 Yes A F 64 17 No P M 74 4 No A F 72 25 No P M
70 1 Yes B M 66 19 No B M 59 29 No A F 64 30 No A M 70 28 No A M 69 1 No B F 78
1 No P M 83 1 Yes B F 69 42 No B M 75 30 Yes P M 77 29 Yes P F 79 20 Yes A M 70
12 No A F 69 12 No B F 65 14 No B M 70 1 No B M 67 23 No A M 76 25 Yes P M 78 12
Yes B M 77 1 Yes B F 69 24 No P M 66 4 Yes P F 65 29 No P M 60 26 Yes A M 78 15
Yes B M 75 21 Yes A F 67 11 No P F 72 27 No P F 70 13 Yes A M 75 6 Yes B F 65 7
No P F 68 27 Yes P M 68 11 Yes P M 67 17 Yes B M 70 22 No A M 65 15 No P F 67 1
Yes A M 67 10 No P F 72 11 Yes A F 74 1 No B M 80 21 Yes A F 69 3 No
;

ods trace on;
ods graphics on;
proc logistic data=Neuralgia;
   class Treatment Sex / param=glm;
   model Pain= Treatment|Sex Age;
   lsmeans Treatment / plots=anom;
run;
ODS displays the following trace output for the analysis-of-means plot:
   Output Added:
   -------------
   Name:       AnomPlot
   Label:      Treatment ANOM Plot
   Template:   Stat.Logistic.Graphics.AnomPlot
   Path:       Logistic.LSMeans.AnomPlot
   -------------
The analysis-of-means plot is displayed in Output 25.8.1. Notice that it has two titles.
You can use the %GrTitle autocall macro to modify the way the graph template specifies titles:
%grtitle(path=Stat.Logistic.Graphics.AnomPlot)
The macro displays the following in the SAS log:
   Stat.Logistic.Graphics.AnomPlot -> Stat.Graphics.AnomPlot
      Graphics_AnomPlot
      Graphics_AnomPlot2
Output 25.8.1: Analysis of Means
The macro begins by displaying the name of the template that you specified in the PATH= argument. In this case, two names are displayed because the specified template is a link. The macro follows links and modifies the actual graph template that is at the end of the link chain. The macro creates and displays the names of two macro variables (because there are two titles) after the template names. The modified template creates titles from the values of the macro variables when those variables exist; it uses the original titles when the macro variables do not exist. The names of the macro variables are constructed from the second and last levels of the template name. In many cases, these two levels are the procedure name and the graph name (but not in this case because of the link).
The following step creates the graph by using the modified template and the two macro variables:
%let Graphics_AnomPlot = Neuralgia Study;
%let Graphics_AnomPlot2 = Analysis of Means with 95% Decision Limits;
proc logistic data=Neuralgia;
   ods select anomplot;
   class Treatment Sex / param=glm;
   model Pain= Treatment|Sex Age;
   lsmeans Treatment / plots=anom;
run;
The modified graph is displayed in Output 25.8.2.
Output 25.8.2: Customized Titles