The CAUSALGRAPH Procedure
Example 37.3 Testing Adjustments and Enumerating Paths
(View the complete code for this example.)
This example illustrates how you can use the CAUSALGRAPH procedure to determine whether a proposed adjustment set is valid for estimating a causal effect in a particular causal model. It also illustrates how you can enumerate the paths that connect the treatment and outcome variables in the model. If a causal effect cannot be identified in a causal model, the enumeration of paths can provide information that might help you modify the study design in order to enable identification of the causal effect.
The causal model shown in Figure 7 is used by Thornley et al. (2013) to examine the relationship between an individual’s serum urate and risk of cardiovascular disease. The model includes the following variables:
Urate: the treatment variableCVD: the outcome variableAntiHypertensiveUse: indicator of antihypertensive drug useCreatinine: measured serum creatinine levelDiabetes: indicator of diabetes diagnosisEthnicity: classification variable for ethnicityGender: indicator for biological maleGout: indicator of gout diagnosisHbA1c: measured glycated hemoglobinMedicationPropensity: latent construct that reflects an individual’s propensity to take prescribed medicationNutrition: latent construct that reflects diet or nutritionObesity: indicator of body mass index 30
30 CurrentBP: measured blood pressureCurrentHDL: measured HDL cholesterolPreviousBP: previous (prior to study) blood pressurePreviousHDL: previous (prior to study) HDL cholesterolSmoking: indicator of current smoking statusStatinUse: indicator of statin drug use
The variables MedicationPropensity and Nutrition correspond to latent constructs and thus cannot be observed. It is also assumed that the variables PreviousBP, PreviousHDL, and Obesity are not observed.
Figure 7: Causal Model of the Effect of Serum Urate on Risk of Cardiovascular Disease
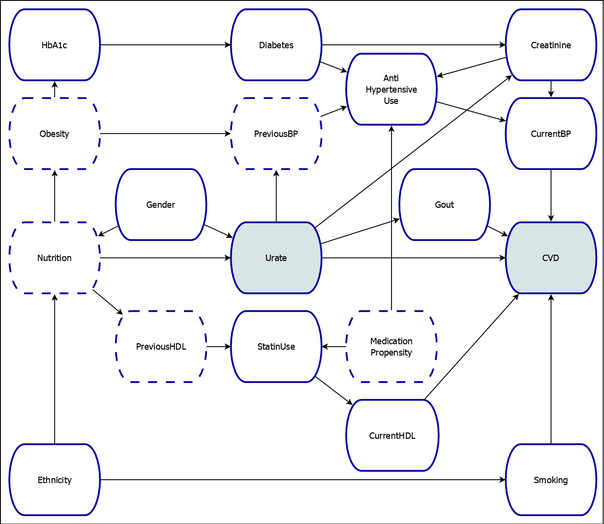
According to this causal model, the statistical association between the variables Urate and CVD reflects a combination of true causal association and additional spurious or noncausal association. In order to isolate the true causal association between these two variables, Thornley et al. (2013) consider adjustment for CurrentHDL, Ethnicity, Gender, HbA1c, and Smoking. The following code invokes the CAUSALGRAPH procedure to test whether this adjustment set can be used to estimate the causal effect of Urate on CVD according to the causal model:
proc causalgraph compact;
   model "Thor12"
      AntiHypertensiveUse ==> CurrentBP,
      Creatinine ==> AntiHypertensiveUse CurrentBP,
      CurrentBP ==> CVD,
      CurrentHDL ==> CVD,
      Diabetes ==> AntiHypertensiveUse Creatinine,
      Ethnicity ==> Nutrition Smoking,
      Gender ==> Nutrition Urate,
      Gout ==> CVD,
      HbA1c ==> Diabetes,
      MedicationPropensity ==> AntiHypertensiveUse StatinUse,
      Nutrition ==> PreviousHDL Urate Obesity,
      Obesity ==> PreviousBP HbA1c,
      PreviousBP ==> AntiHypertensiveUse,
      PreviousHDL ==> StatinUse,
      Smoking ==> CVD,
      StatinUse ==> CurrentHDL,
      Urate ==> PreviousBP Creatinine CVD Gout;
   identify Urate ==> CVD;
   unmeasured Nutrition Obesity PreviousBP MedicationPropensity PreviousHDL;
   testid CurrentHDL Ethnicity Gender HbA1c Smoking;
run;
In the MODEL statement, you specify the causal model to be analyzed. The quoted string in the statement labels the model. The remainder of the MODEL statement specifies all the variables and edges in the model. These variables and edges reflect the hypothesized data generating process shown in Figure 7.
In the IDENTIFY statement, you specify the causal effect of interest. You can use this statement to specify one or more treatment variables and one or more outcome variables. The treatment and outcome variables are separated by a single right arrow, ==>. In this example, you are interested in testing the identification of the causal effect of Urate on CVD.
In the UNMEASURED statement, you specify variables that are not observed and thus cannot be included in an adjustment set. In this example, five variables are specified as unmeasured.
Because the METHOD= option is not specified in the PROC CAUSALGRAPH statement, the procedure uses the constructive backdoor criterion (METHOD=ADJUSTMENT) by default to test the identification of the causal effect by the adjustment set that you specify in the TESTID statement.
The COMPACT option in the PROC CAUSALGRAPH statement displays the output table in a compact manner. For this example, this means that a column is added for a covariate in the adjustment test output table only if that variable actually appears in the test.
As shown in Output 37.3.1, the proposed adjustment set is marked "No" in the Valid column, so it is not sufficient to estimate the causal effect of Urate on CVD.
Output 37.3.1: Adjustment Set Test for the Model in
| Covariate Adjustment Test: Test1 | ||||||||
|---|---|---|---|---|---|---|---|---|
| Causal Effect of Urate on CVD | ||||||||
| Model | Size | Valid | Minimal | Covariates | ||||
| CurrentHDL | Ethnicity | Gender | HbA1c | Smoking | ||||
| Thor12 | 5 | No | No | * | * | * | * | * |
To see why the proposed adjustment set is not valid, you can request an enumeration of the proper paths that connect the treatment to the outcome in the model. You can also use the procedure to search for a valid adjustment set. The following code invokes the CAUSALGRAPH procedure to perform these two tasks:
proc causalgraph compact list;
   model "Thor12"
      AntiHypertensiveUse ==> CurrentBP,
      Creatinine ==> AntiHypertensiveUse CurrentBP,
      CurrentBP ==> CVD,
      CurrentHDL ==> CVD,
      Diabetes ==> AntiHypertensiveUse Creatinine,
      Ethnicity ==> Nutrition Smoking,
      Gender ==> Nutrition Urate,
      Gout ==> CVD,
      HbA1c ==> Diabetes,
      MedicationPropensity ==> AntiHypertensiveUse StatinUse,
      Nutrition ==> PreviousHDL Urate Obesity,
      Obesity ==> PreviousBP HbA1c,
      PreviousBP ==> AntiHypertensiveUse,
      PreviousHDL ==> StatinUse,
      Smoking ==> CVD,
      StatinUse ==> CurrentHDL,
      Urate ==> PreviousBP Creatinine CVD Gout;
   identify Urate ==> CVD;
   unmeasured Nutrition Obesity PreviousBP MedicationPropensity PreviousHDL;
   testid Gender HbA1c Ethnicity Smoking
      CurrentHDL / paths=(noncausal nonblocked);
run;
The PATHS option in the TESTID statement requests an analysis of the proper paths in the model when the variables in the TESTID statement are being adjusted for identifying the causal effect. By default, the procedure prints all proper paths when you specify the PATHS option. You can change this behavior by specifying additional suboptions. In this example, the NONCAUSAL and NONBLOCKED suboptions display only noncausal paths that are not blocked. For more information about the terminology of paths in DAGs, see the section Terminology.
Output 37.3.2 shows the proper paths in the model that are not causal and are not blocked. There are two such paths. If you were to use the proposed adjustment set, some of the association between Urate and CVD would be attributable to these two noncausal paths, and the causal effect would not be estimated correctly. The first path is not blocked because the variable StatinUse is a collider on the path and one of its descendants, the variable CurrentHDL, appears in the adjustment set. The second path does not contain any colliders but is not blocked because it does not contain any element of the proposed adjustment set. For more details about the flow of information in DAGs, see the section Statistical Properties of Causal Models.
Output 37.3.2: Analysis of Proper Paths
| Treatment-to-Outcome Paths | |||
|---|---|---|---|
| Test Test1 for Model Thor12 | |||
| Causal Effect of Urate on CVD Adjusted for {CurrentHDL Ethnicity Gender HbA1c Smoking} | |||
| Causal | Blocked | Paths | |
| 1* | No | No | Urate <== Nutrition ==> PreviousHDL ==> StatinUse <== MedicationPropensity ==> AntiHypertensiveUse ==> CurrentBP ==> CVD |
| 2* | No | No | Urate <== Nutrition ==> Obesity ==> PreviousBP ==> AntiHypertensiveUse ==> CurrentBP ==> CVD |
| * indicates a biasing path | |||
Because the adjustment set in the TESTID statement leads to two nonblocked, noncausal paths, it is not valid for identifying the specified causal effect. The next question to ask is whether there are any valid adjustment sets. You can use the LIST option in the PROC CAUSALGRAPH statement to address this question. The LIST option lists all valid adjustment sets.
The note in Output 37.3.3 summarizes the results of the search for any adjustment set that can be used to identify the effect of Urate on CVD in the model in Figure 7. For this causal model, it is not possible to use an adjustment set to estimate the causal effect.
Output 37.3.3: Adjustment Set List Summary Note
| NOTE: There are no adjustment sets satisfying the specified criteria for Thor12. |
In order to obtain identifiability, you might consider collecting additional data. For example, if you were to collect data for the variables Obesity and PreviousHDL so that these two variables are no longer unmeasured, then you could block the two noncausal paths in Output 37.3.2. The following code demonstrates this:
proc causalgraph compact;
   model "Thor12"
      AntiHypertensiveUse ==> CurrentBP,
      Creatinine ==> AntiHypertensiveUse CurrentBP,
      CurrentBP ==> CVD,
      CurrentHDL ==> CVD,
      Diabetes ==> AntiHypertensiveUse Creatinine,
      Ethnicity ==> Nutrition Smoking,
      Gender ==> Nutrition Urate,
      Gout ==> CVD,
      HbA1c ==> Diabetes,
      MedicationPropensity ==> AntiHypertensiveUse StatinUse,
      Nutrition ==> PreviousHDL Urate Obesity,
      Obesity ==> PreviousBP HbA1c,
      PreviousBP ==> AntiHypertensiveUse,
      PreviousHDL ==> StatinUse,
      Smoking ==> CVD,
      StatinUse ==> CurrentHDL,
      Urate ==> PreviousBP Creatinine CVD Gout;
   identify Urate ==> CVD;
   unmeasured Nutrition PreviousBP MedicationPropensity;
   testid Gender HbA1c Ethnicity Smoking
      CurrentHDL PreviousHDL Obesity;
run;
As shown in Output 37.3.4, the proposed adjustment set is marked "Yes" in the Valid column, so it is sufficient to estimate the causal effect of Urate on CVD. For more information about possible approaches to obtain identifiability, see the section Dealing with Nonidentified Causal Effects.
Output 37.3.4: Adjustment Set Test
| Covariate Adjustment Test: Test1 | ||||||||||
|---|---|---|---|---|---|---|---|---|---|---|
| Causal Effect of Urate on CVD | ||||||||||
| Model | Size | Valid | Minimal | Covariates | ||||||
| CurrentHDL | Ethnicity | Gender | HbA1c | Obesity | PreviousHDL | Smoking | ||||
| Thor12 | 7 | Yes | No | * | * | * | * | * | * | * |