The PSMATCH Procedure
Process of Propensity Score Analysis
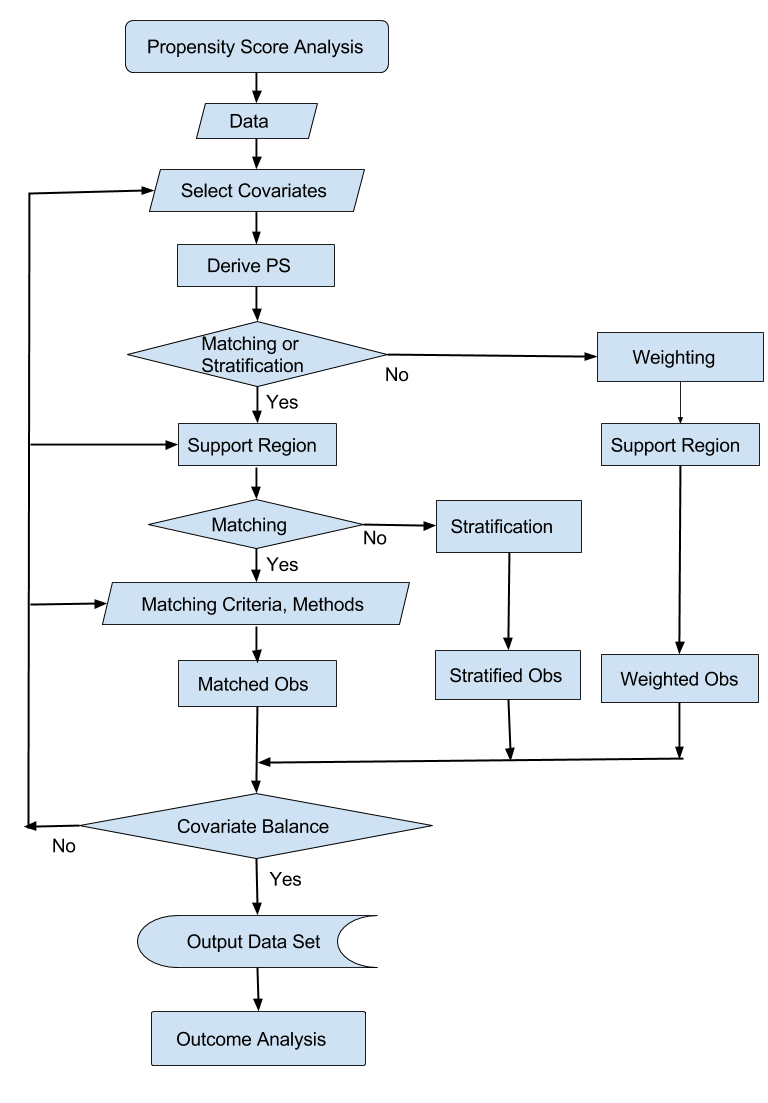
A propensity score analysis usually involves the following steps (Guo and Fraser 2015, p. 131):
You specify a set of confounding variables that might be related to both the treatment assignment and the outcome.
You use this set of variables to fit a logistic regression model and compute propensity scores. The response is the probability of assignment to the treatment group.
If you are using weighting, you compute observation weights for estimating the treatment effect in a weighted outcome analysis.
If you are using stratification or matching, you specify the support region for observations. Observations outside this region are not included in the stratification or matching.
If you are using stratification, you specify the number of strata and create strata of observations that have similar propensity scores.
If you are using matching, you specify the distance metric for similarity of observations and the method for creating matched sets of observations. You can also compute weights for matched observations.
You assess the balance of variables by comparing the distributions between the treated and control groups.
To improve the balance, you can repeat the process with a different set of variables for the logistic regression model, a different region of support for stratification and matching, a different distance metric, or a different matching method.
When you are satisfied with the variable balance, you save the output data set for subsequent outcome analysis.
Propensity score analysis assumes that all the variables that affect both the outcome and the treatment assignment have been measured, but this assumption cannot be tested. In some cases, you can perform sensitivity analysis to examine this assumption; see the section Sensitivity Analysis.
Note that the outcome variable is intentionally not used in these steps, and the selection of variables for the model should be made independently of the observed outcomes (Rubin 2001; Stuart 2010, p. 5). Furthermore, any variables that might have been affected by the treatment should not be included in the process (Rosenbaum and Rubin 1984; Stuart 2010, p. 5).
The flowchart in Figure 1 summarizes the steps.
After balance is achieved, you can add the response variable to the output data set that PROC PSMATCH created and perform an outcome analysis that mimics the analysis you would perform with data from a randomized study. For example, if you used matching, a simple univariate test or analysis might be sufficient to estimate the treatment effect.
Figure 1: Propensity Score Analysis