Statistical Graphics Using ODS
Sparse Data and Overfitting
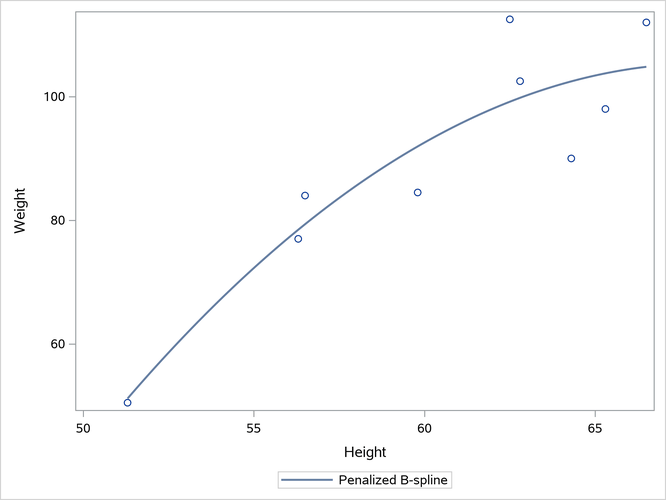
Penalized B-splines (and many other methods) do not work well with sparse data. For example, data sets might be small and sparse when you are following the results of a medical test for a single subject over time. You might want to fit a smooth function through the results rather than simply connect the dots. The following step creates the plot in Output 24.6.6:
proc sgplot data=sashelp.class(where=(sex='F'));
   pbspline y=weight x=height;
run;
Output 24.6.6: Overfit Sparse Data

The X and Y coordinates of the fit function consist of 201 equally spaced X values that range from the minimum of X to its maximum. The Y values are computed from those X values and the coefficients. Penalized B-splines (and other spline methods) do not use the interpolation data when they compute the smoothing parameter and coefficients. First they analyze the actual data values, and then they compute the interpolated values.
The data are so sparse and the model has so many parameters that the computations fail to produce a reasonable nonlinear fit function. You can see that the interpolated Y values extend well beyond the range of the data. You see this again in the section Multiple Fit Functions Using PROC SGPLOT, where you also see other remedies, including restricted splines. For information about interpolation, also see the section Interpolation.
A perfect connect-the-dots fit instead of the fit plot in Output 24.6.6 would look reasonable. In contrast, displaying the interpolated values more fully shows the spline function and shows that the results are overfit and not generalizable. You can manually set the smoothing parameter to get a better fit function. Larger values create a smoother fit function. The following step creates the plot in Output 24.6.7:
proc sgplot data=sashelp.class(where=(sex='F'));
   pbspline y=weight x=height / smooth=2e5;
run;
Output 24.6.7: Manually Set Smoothing Parameter
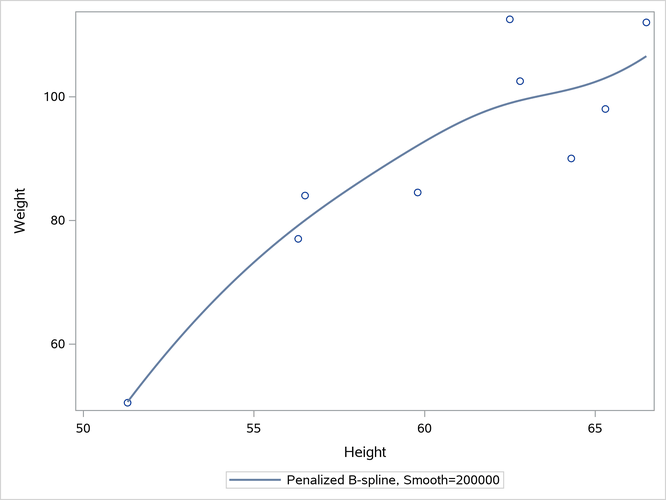
Usually, it takes some trial and error to set the smoothing parameter. You can use the penalized B-spline functionality in PROC TRANSREG to see which smoothing parameters it considers. PROC SGPLOT and PROC TRANSREG use the same code. Alternatively, you can specify fewer knots. By default, there are 100 knots. The following step specifies NKNOTS=20 and creates the plot in Output 24.6.8:
proc sgplot data=sashelp.class(where=(sex='F'));
   pbspline y=weight x=height / nknots=20;
run;
Output 24.6.8: Twenty Knots